Click here to access the data window.
NIHAK has launched a Data Window that, for the first time, brings together a comprehensive overview of clean transition investment projects in the NIHAK operating area and neighbouring municipalities. The Data Window responds to a timely need to make planned and ongoing investments in the region visible and easy to understand for companies, municipalities and educational institutions.
The Data Window currently includes 132 clean transition projects located in the NIHAK area or nearby municipalities. The projects range from pre-planning to construction and completion. All information presented in the Data Window is based on publicly available sources, data provided by the investors themselves, and commonly used estimates. The projects represent a broad spectrum of clean energy and technology solutions, including wind and solar power, battery and electricity storage, biogas and biofuel production, hydrogen and e-fuel projects, as well as the development of electricity grid infrastructure.
From Words to Action
The investment outlook for the coming years is exceptionally strong. During 2026–2027, the combined value of projects at the investment decision stage will exceed EUR 1 billion. For 2026 alone, the value of already approved investments is approximately EUR 315 million, while projects at the investment decision stage amount to around EUR 800 million. When projects progressing on a longer time horizon are also included, NIHAK estimates that the total long-term value of the investments compiled in the Data Window will exceed EUR 10 billion.
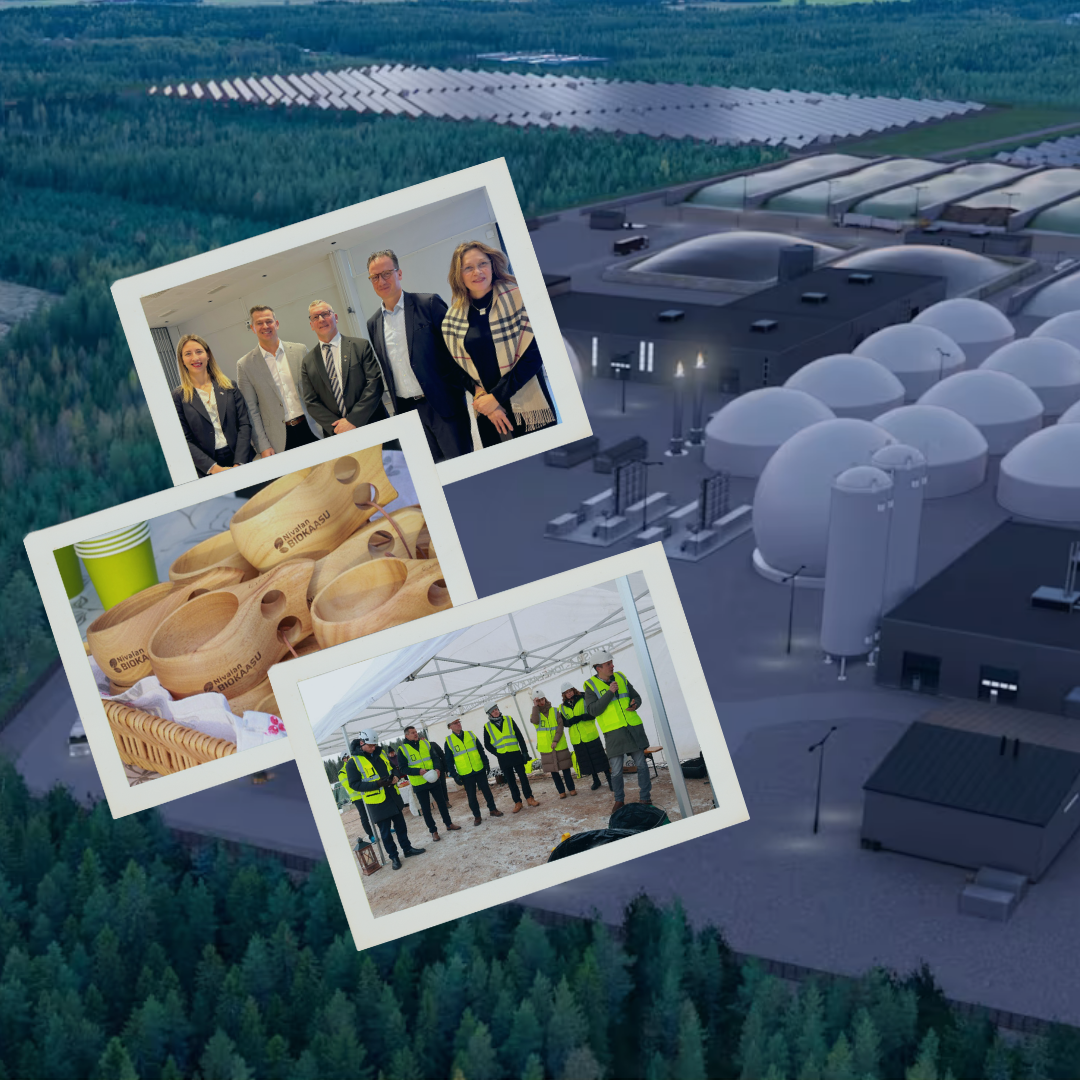
The Data Window also highlights the concrete scale of the projects. Several major investments that have advanced to the construction phase are already underway in the region, such as the Nivala biogas plant, with a total value of approximately EUR 100 million. In addition, several large battery storage facilities, substations and transmission line projects are under construction, and preparations are ongoing for extensive wind and solar power projects, with individual investment values ranging from tens of millions to several hundred million euros.
Projects have been selected for the Data Window primarily based on location, but it also includes investments that, by their type and impact, strengthen the region’s vitality. The goal is for regional companies to see the entire nearby market at a glance and to identify future subcontracting, cooperation and business opportunities at an early stage. Understanding the different phases of investment projects is essential, as project development, permitting, construction and commissioning generate demand for services and expertise over several years.
A Tool Also for Decision-Makers
The Data Window also serves municipalities and decision-makers by providing up-to-date information on the direction of regional development. The scale of investments is directly reflected in needs related to housing, education, infrastructure and workforce availability. The construction phase of energy and industrial projects creates significant demand for labour in the region, particularly in earthworks and infrastructure construction, electrical and automation installations, HVAC and cooling solutions, and mechanical installation.
The Data Window is openly available to everyone via NIHAK’s website. The data has been compiled into a Google Maps–based map application that allows users to view projects by location, technology and project phase, and to track the progress of investments. The content is updated regularly, and NIHAK actively collects feedback to ensure that the Data Window continues to meet the needs of regional stakeholders.
In NIHAK’s work, the Data Window serves as a key tool for promoting clean transition investments and supporting regional development. It brings together fragmented, publicly available information, makes the scale of investments visible, and strengthens NIHAK’s role as a provider of forward-looking information for regional businesses and municipalities.
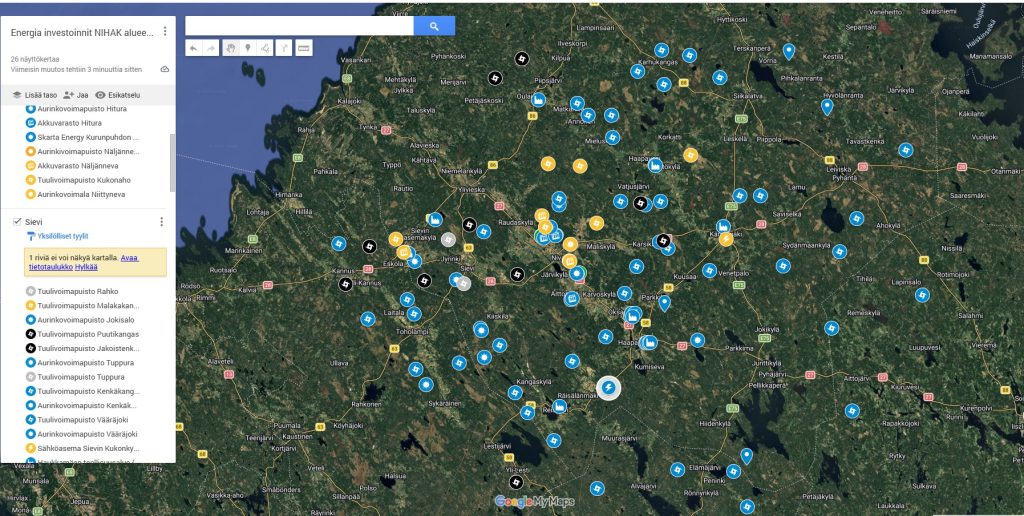
The Data Window can be accessed via NIHAK’s website. In the map application, investment projects are illustrated with clear icons and colours that indicate the project type and stage of progress. Icons represent, among others, wind and solar power, electricity and battery storage, and industrial investments, while colours distinguish between projects in pre-planning and permitting, permit-ready, under construction, and operational phases. This makes it easier to grasp the overall picture and compare projects at a glance.
Explore NIHAK’s Data Window here.
Explanation of icons and colors:
Icons:
Circle blade = wind turbine
Sun = solar power plant
Square with icon inside = electricity (battery) storage
Factory = productive investment
Colors:
Blue = preliminary design – permitting phase
Yellow = permit ready
Green = under construction
Black = in operation
Click here to access the data window.